Welcome back!
Today I’m looking into Uptime Kuma, a monitoring tool that in my eyes is perfect, simple and intuitive and does exactly what I need for monitoring my home network. What is Uptime Kuma? I’m glad you asked.
The Background
Uptime Kuma is an Open Source monitoring solution, perfect for SOHO (Small Office/Home Office) environments where there isn’t a ton of devices/services to monitor. I’ve been looking for something like this for some time after building a very rudimentary monitoring system for myself (relying solely on ping and notifying via webhooks in Slack). This is one of those pieces of software I wish I had known about for years.
The setup is exceptionally simple, especially when using Docker. I simply used a small Dell SFF Optiplex (i3, 4GB RAM, 240GB SSD) running Ubuntu 22.04LTS which is more than capable of handling the 40-50 checks I’m running. Using a dedicated instance instead of a virtual machine on one of my hosts also will allow me to monitor in case those hosts go offline.
The Build
As I mentioned, I simply installed a base image of Ubuntu 22.04LTS to have the latest software running. Then, use snap to install docker:
snap install docker
Then, install the Uptime Kuma docker to run in the background automatically:
docker run -d --restart=always -p 3001:3001 -v uptime-kuma:/app/data --name uptime-kuma louislam/uptime-kuma:1
Fire up a web browser and go to http://YOUR_DEVICE_IP:3001 to set up an admin account and begin working with the software. Note: Installing this way will automatically bring up the docker in the background upon reboot.
Putting it together:
For Uptime Kuma, there are a wide variety of tests and monitors it can use to keep tabs on your network. I’m using a mix of Ping, TCP and DNS checks to make sure my network is working as expected. This also helped me sort out a brief internet outage this morning.
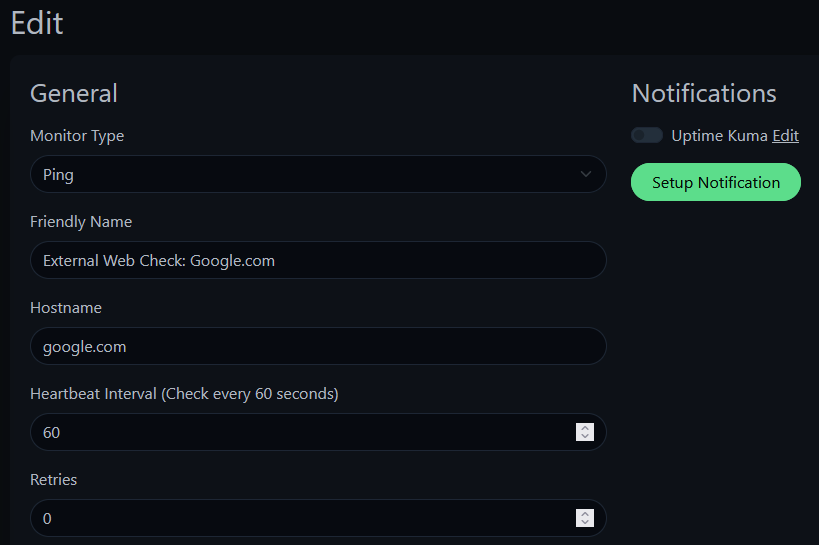
An example of one I use to make sure my internet is actually connected is to simply ping Google.com every minute to make sure my traffic can get to the WAN:

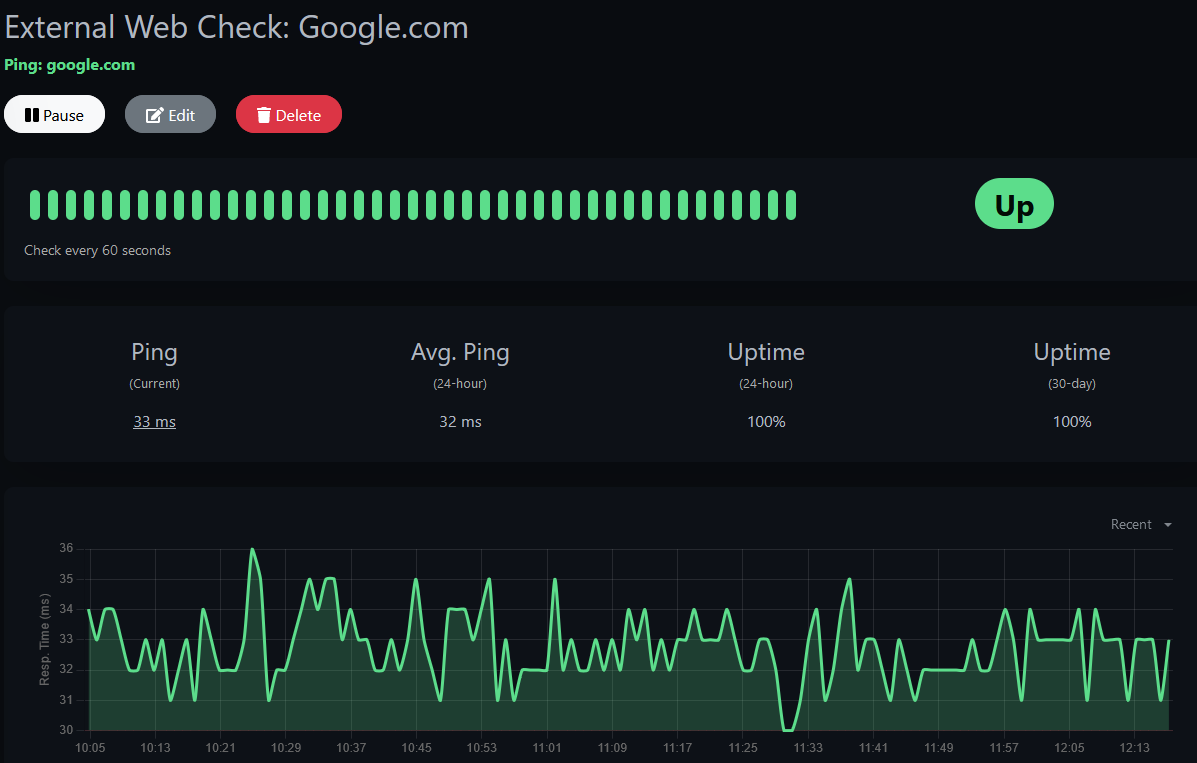
If this goes down, then my WAN connection to the internet isn’t working and gives me an immediate pop up on the page to tell me. The dashboards are pretty cool too:

Neat, so there’s the checks for the internet down to monitor when/if the internet goes down.
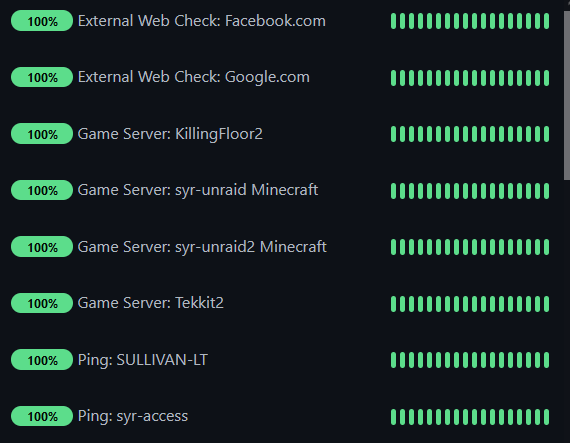
One thing to keep in mind is how you name the devices/ports/etc that are being monitored. My solution was to name the test first, then the device in question so at a glance I know what I’m looking at:

From top to bottom: First two are WAN access checks, then TCP port checks for my various servers I host for my friends and I. The TCP port is super handy for monitoring when a process/services goes offline. The third portion is where I begin the Ping tests for my home devices.
The Wrap Up
All in all, this is the solution I’ve been looking for for a long time now. It’s simple, elegant and easy to use while still being extremely valuable as a monitoring tool. The system I run uses a private Discord server to notify me if anything goes down, less than 5 minutes after, normally less than 1 minute. Being able to configure retries and time outs is also very handy too for high latency connections. I can only recommend this software to someone wanting to set up more monitoring for their SOHO network, but I could see this being used for enterprise solutions as well. Uptime Kuma, you have a new fan.
Leave a Reply
You must be logged in to post a comment.